ChartTrainer / ICT trading simulator
Free ICT trading simulator for smart money concepts.
Practice ICT and smart money concepts on a chart that replays candle by candle with the date hidden, so you can't know how the session ends. Add kill zones, fair value gaps, order blocks and liquidity sweeps on real NQ and ES days, trade the setup with a stop and a target, then backtest the same idea on past sessions.
- Free plan, no card needed
- $0 evaluation resets
- Kill zones, gaps and order blocks
What it looks like
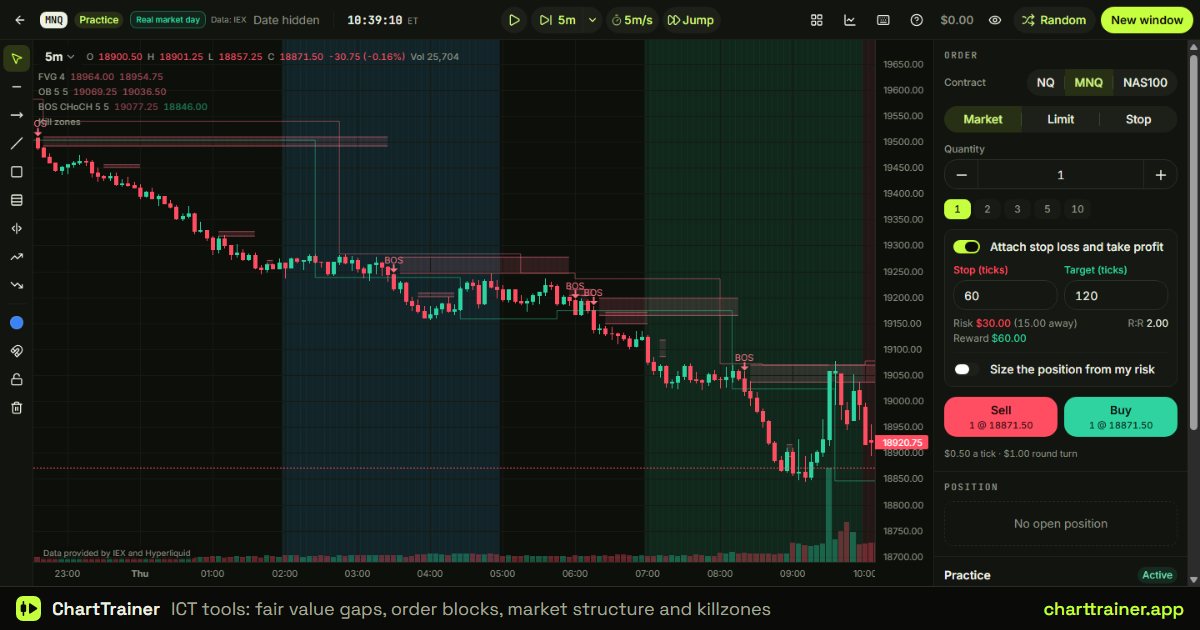
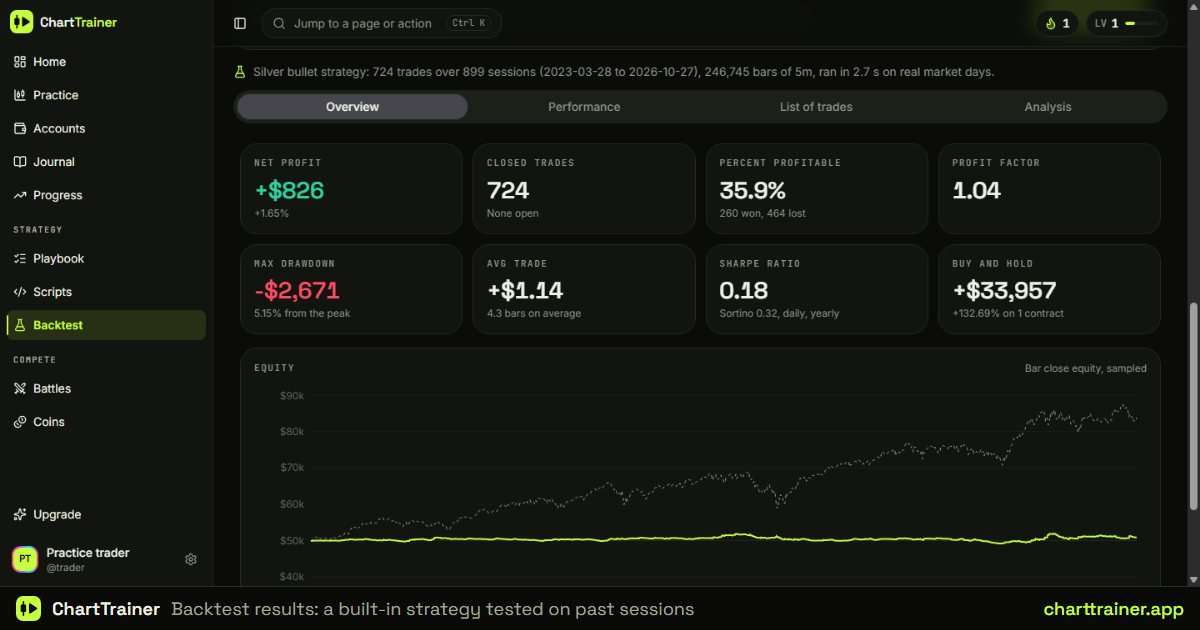
ICT tools on your chart
Every tool runs on New York time. From 9:30 to 16:00 the chart is real trades. Asia and London use real perpetual prices for NQ, ES, gold and oil from April 2026 and are modeled on older days, so setups inside New York hours, like the silver bullet window, are the cleanest to test.
- Kill zones: Shades Asia, the London open, the New York open and the London close. Change any window in the settings.
- Fair value gaps: Marks three candle imbalances and keeps the latest open bullish and bearish gap until price fills it.
- Order blocks: After a break of a swing, marks the last opposite candle before the move and keeps it until price closes through it.
- Market structure: Tracks swing highs and lows and labels each close beyond them as a break of structure (BOS) or a change of character (CHoCH).
- Liquidity sweeps: Draws the previous day and Asia highs and lows and marks each candle that trades through one and closes back inside.
- Silver bullet and FVG strategies: Two ready strategies to run in the backtester: the 10:00 to 11:00 silver bullet window and a fair value gap retrace.
- Setup tags in the journal: Tag each trade with fair value gap, liquidity sweep or your own confluences, and see which setups pay in Progress.
How it works
- Add the tools. Open the indicators button, pick the Smart money (ICT) group and add what you use. Every tool is a script you can open and change.
- Trade it without hindsight. Start a random day at the New York open with the date hidden. Wait for your setup, enter with a stop and target, and let the candles decide.
- Test it on past sessions. Run the silver bullet or fair value gap strategy in the backtester, or write your own version, and read the results by hour, weekday and month.
Take your ICT setups into an evaluation
Once a setup holds up, trade it on an evaluation account with a profit target, a trailing or static drawdown and a daily loss limit, all checked on every candle. Edit any rule before you start.
- 50K, 100K, 150K Evaluation: End of day trailing drawdown, daily loss limit, 50% consistency
- 50K, 100K Intraday Trail: Real time trailing drawdown on unrealized peak, no daily limit
- 50K Static: Fixed max loss that never trails, hard daily loss limit
Questions
- Can I practice ICT concepts here?
- Yes. Replay a session candle by candle with the date hidden, add kill zones, fair value gaps, order blocks, market structure and liquidity sweeps to the chart, and trade what you see with a stop and a target. Every trade lands in the journal, where you can tag the setup.
- Can I backtest ICT setups?
- Yes. The library has a fair value gap retrace strategy and a silver bullet strategy you can run in the backtester and change in the script editor, or you can write your own. The report shows every trade on a chart, results by hour and your odds of passing an evaluation.
- Does it have ICT kill zones?
- Yes. The Kill zones indicator shades Asia (20:00 to 22:00), the London open (2:00 to 5:00), the New York open (7:00 to 10:00) and the London close (10:00 to 12:00), New York time. You can change every window.
- Which markets work best for ICT practice?
- NQ, MNQ, ES and MES, and gold as XAUUSD, GC or MGC, which all replay real market days. Currency pairs like EUR/USD are there too, on generated data for now, so they aren't real sessions.
- Do these tools prove a setup works?
- No. They mark the concepts so you can test them. Each one is our own reading of the idea, so compare it with how you define a gap or a block and change the script if yours differs. Results in practice don't promise real results.
- Is ChartTrainer affiliated with ICT?
- No. ChartTrainer isn't affiliated with the Inner Circle Trader. ICT and smart money concepts are common names for these ideas, and the tools here are our own versions.
- Is the ICT simulator free?
- Yes. The Free plan never expires and needs no card: 45 minutes of replay and 30 trades a day, 1 evaluation account, the journal, the daily challenge and battles. Pro ($19 a month) removes the daily limit.
Learn more: What Is a Fair Value Gap? Rules and How to Test It · Order Block Trading: What It Is and How to Test It · ICT Kill Zones: Times in New York, London and UTC · Liquidity Sweep: What It Is and How to Trade It · ICT Silver Bullet Strategy: Rules and How to Test It
More simulators
- Futures trading simulator: NQ, MNQ, ES, MES, Dow, Russell, crude and gold with real tick values.
- Forex trading simulator: EUR/USD, GBP/USD, AUD/USD, gold and index CFDs in lots from 0.01.
- Gold trading simulator: Spot gold and gold futures on real market days, in lots or contracts.
- Crypto trading simulator: Bitcoin, Ether and Solana around the clock, weekends included.
- Stock trading simulator: Apple, Tesla, Nvidia, Microsoft, Amazon and more, from the opening bell to the close.
- Prop firm challenge simulator: Trailing drawdown, daily loss and consistency rules checked on every candle.
- Backtesting software: Backtest by hand on a replay, or run a strategy with costs and a full report.
- Free chart replay: Replay past market days candle by candle, with the date hidden and a random start.
- Paper trading simulator: Practice trading with no broker and no money: futures, stocks, forex and crypto.